使用Visual Studio Code在Microsoft Fabric中进行数据科学
您可以在VS Code中为Microsoft Fabric构建和开发数据科学和数据工程解决方案。Microsoft Fabric的VS Code扩展为处理Fabric组件、湖仓、笔记本和用户数据函数提供了集成开发体验。
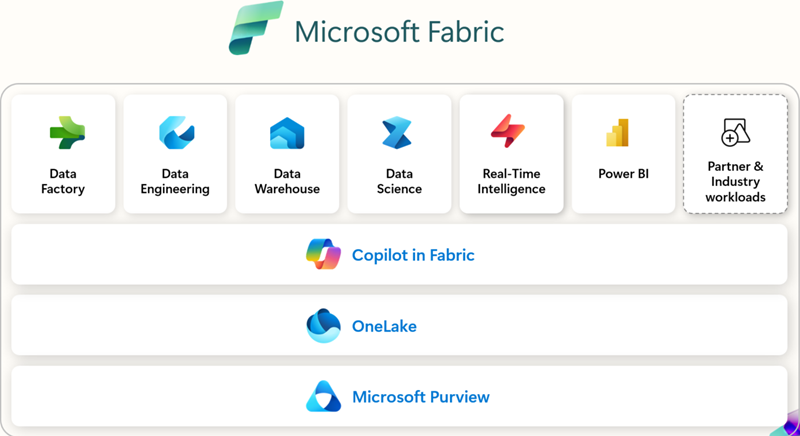
什么是Microsoft Fabric?
Microsoft Fabric 是一个企业级的端到端分析平台。它统一了数据移动、数据处理、摄取、转换、实时事件路由和报告构建。它通过集成数据工程、数据工厂、数据科学、实时智能、数据仓库和数据库等服务来支持这些功能。免费注册 并探索 Microsoft Fabric 60 天 — 不需要信用卡。
先决条件
在开始使用 Microsoft Fabric 扩展之前,您需要:
- Visual Studio Code:安装最新VS Code版本。
- Microsoft Fabric 账户:您需要访问 Microsoft Fabric 工作区。您可以注册免费试用以开始使用。
- Python:安装Python 3.8 或更高版本以在Jupyter Notebook和用户数据函数中使用 VS Code。
安装和设置
您可以在 Visual Studio 市场 或直接在 VS Code 中找到并安装扩展。选择 扩展 视图 (⇧⌘X (Windows, Linux Ctrl+Shift+X)) 并搜索 Microsoft Fabric.
使用哪些扩展
| 扩展 | 最佳选择 | 主要特点 | 如果您是… | 文档 |
|---|---|---|---|---|
| 微软 Fabric 扩展 | 通用工作区管理、项目管理以及使用项目定义 | - 管理Fabric项目(Lakehouses、Notebooks、Pipelines) - Microsoft账户登录和租户切换 - 统一或分组项目视图 - 使用IntelliSense编辑Fabric Notebook - Command Palette集成( 面料:命令) |
您希望直接从 VS Code 对 Fabric 中的扩展、笔记本和项目进行管理。 | 什么是Fabric VS Code扩展 |
| Fabric 用户数据功能 | 开发人员构建自定义转换和工作流 | - 在Fabric中编写无服务器函数 - 在本地使用断点进行调试 - 管理数据源连接 - 安装/管理Python库 - 直接将函数部署到Fabric工作区 |
您构建自动化或数据转换逻辑,并需要在 VS Code 中进行调试 + 部署。 | 在 VS code 中开发用户数据功能 |
| 面料数据工程 | 数据工程师处理大规模数据和Spark | - 探索 Lakehouse(表,原始文件) - 开发/调试 Spark 笔记本 - 构建/测试 Spark 作业定义 - 在本地 VS Code 和 Fabric 之间同步笔记本 - 预览模式和示例数据 |
您使用Spark、湖仓或大规模数据管道,并希望在本地进行探索、开发和调试。 | 在 VS Code 中开发 Fabric 笔记本 |
入门指南
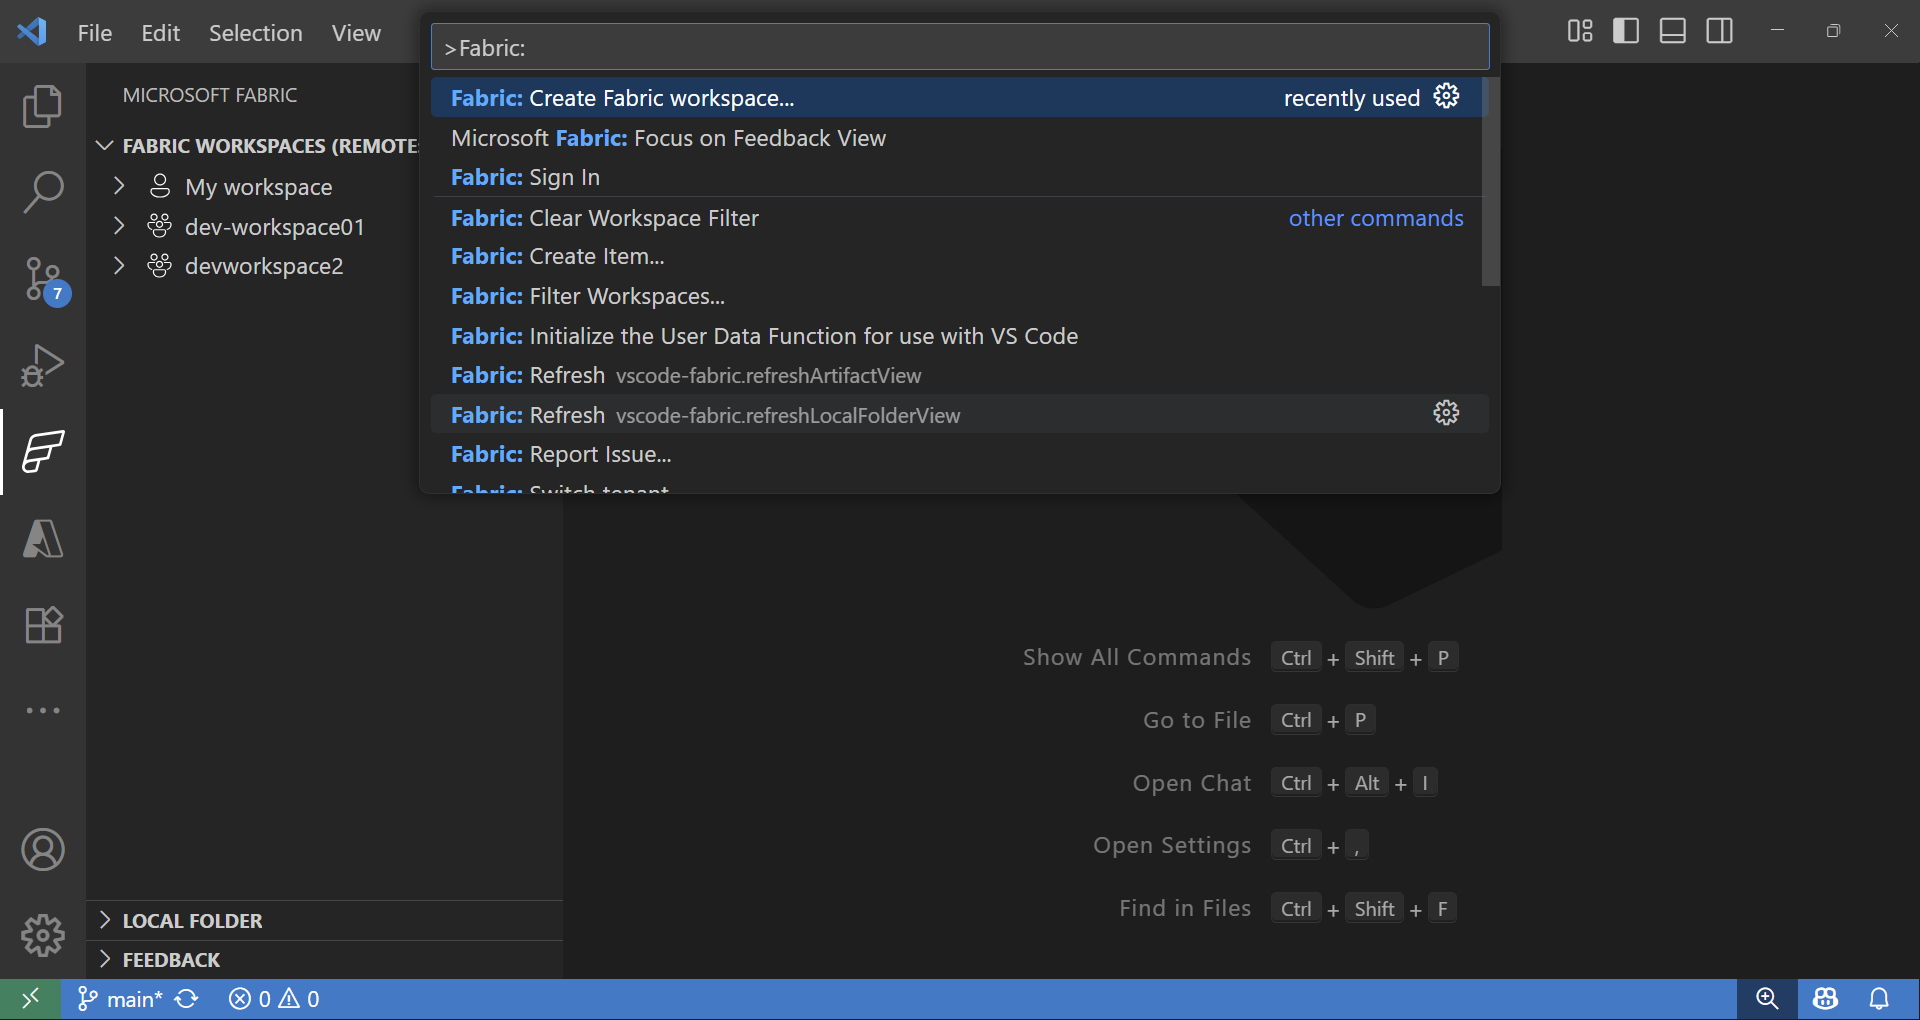
一旦你安装并登录了扩展,你就可以开始使用Fabric工作区和项目。在命令面板 (⇧⌘P (Windows, Linux Ctrl+Shift+P))中,输入 Fabric 以列出特定于Microsoft Fabric的命令。
织物工作区和项目浏览器
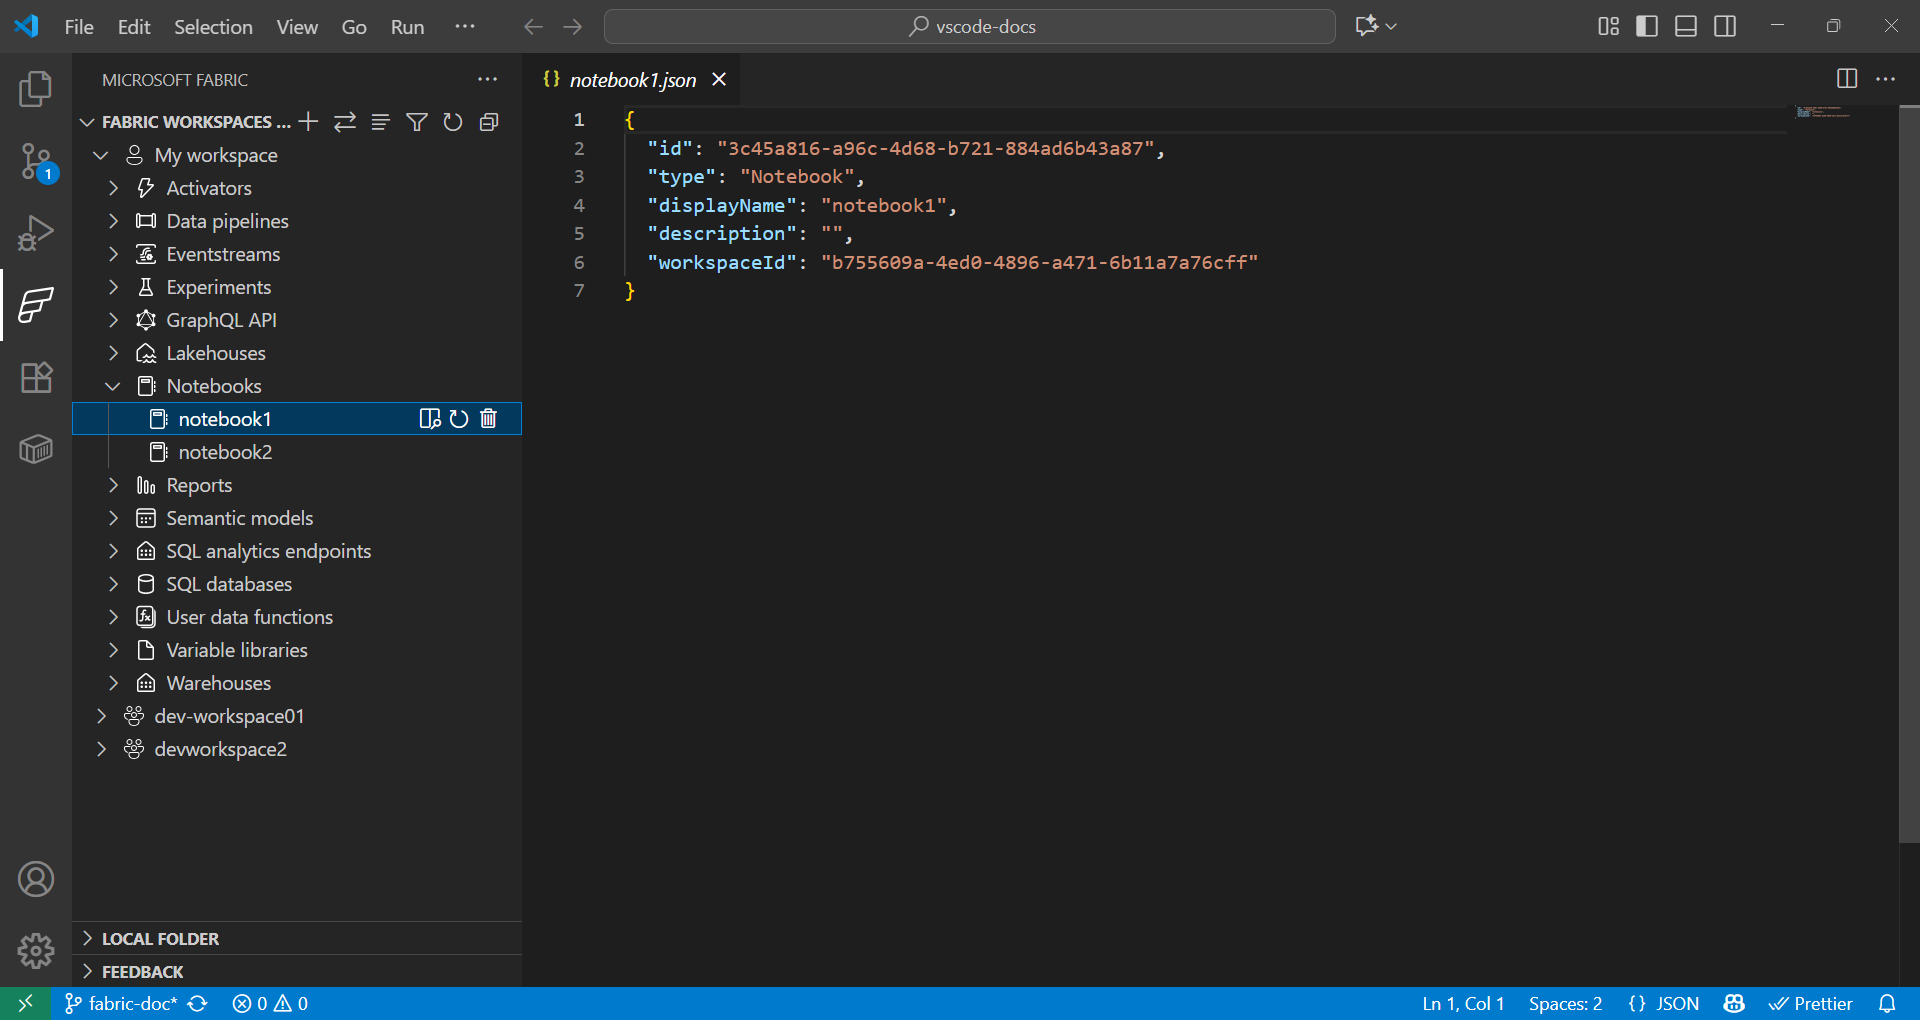
Fabric扩展提供了无缝处理远程和本地Fabric项目的方法。
- 在 Fabric 扩展中,Fabric 工作区 部分列出了来自您的远程工作区的所有项目,按类型组织(数据湖、笔记本、管道等)。
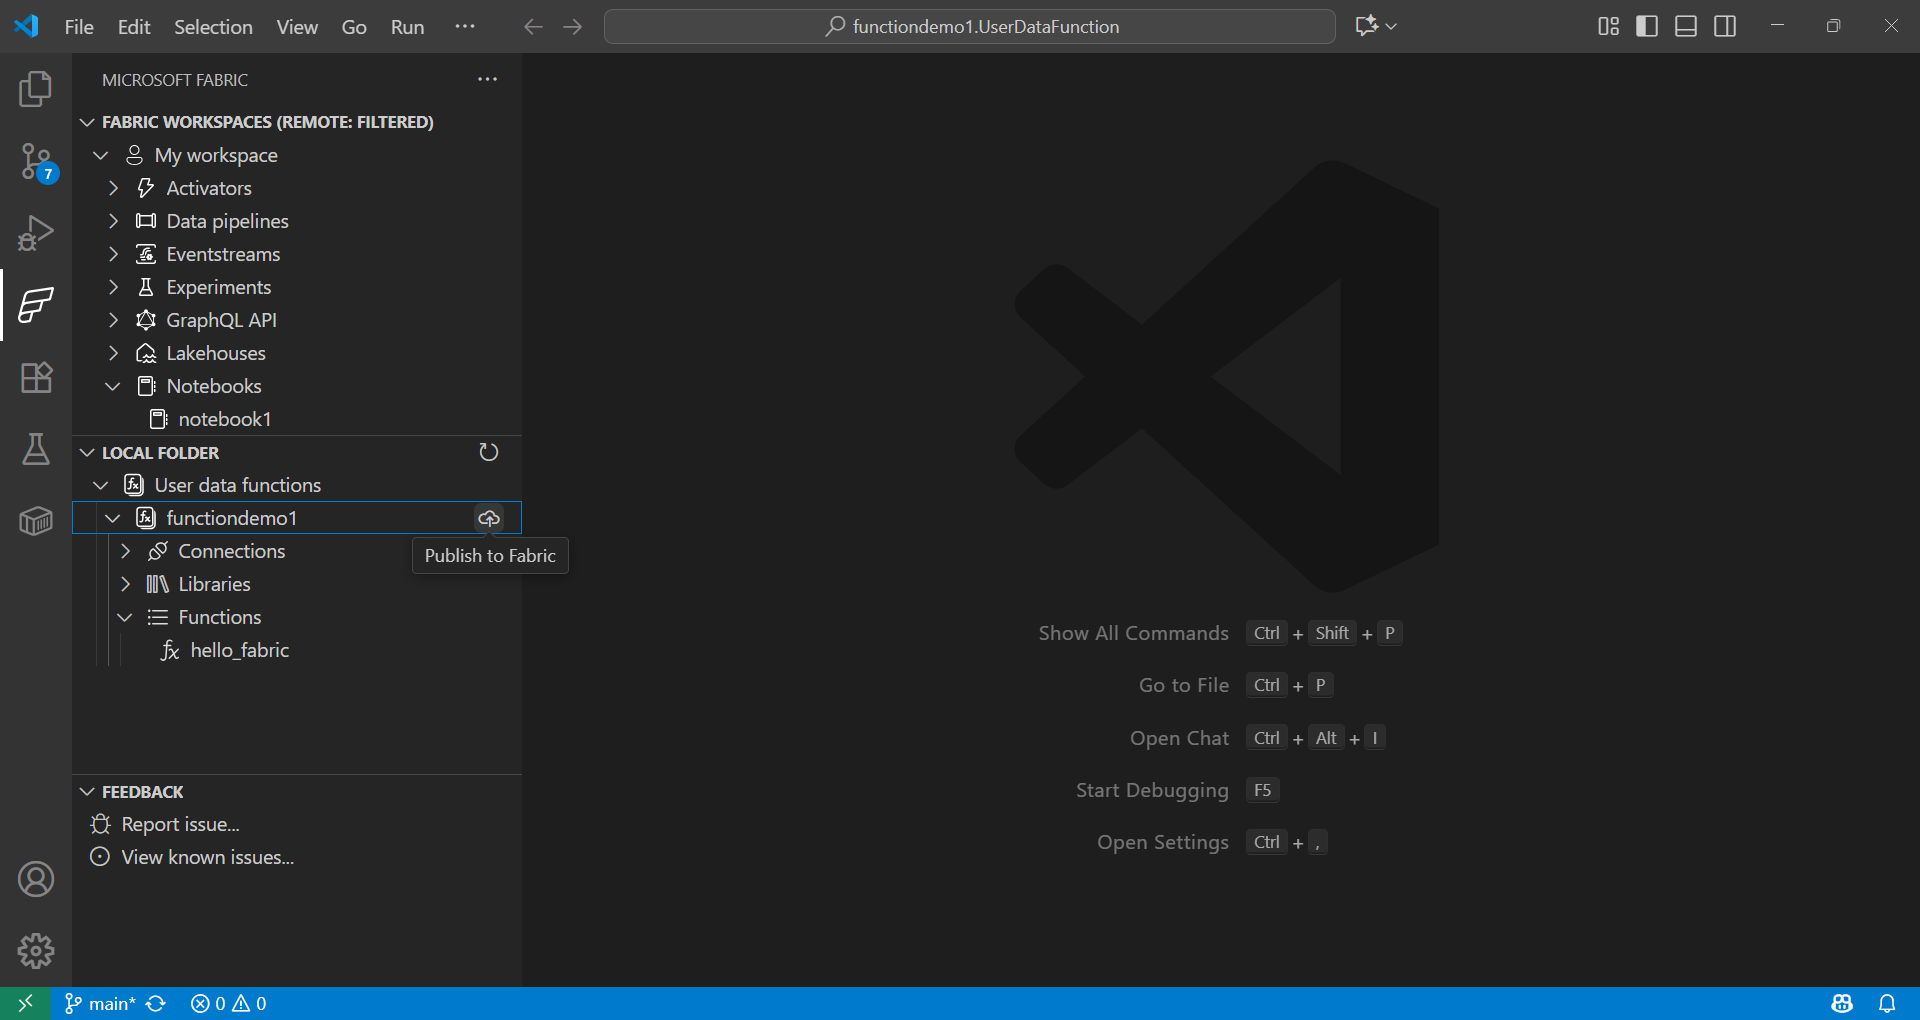
- 在Fabric扩展中,本地文件夹部分显示在VS Code中打开的Fabric项目文件夹。它反映了在VS Code中打开的每种类型Fabric项目的定义结构。这使您能够在本地开发,并将更改发布到当前或新的工作区。
使用用户数据功能进行数据科学
-
在命令面板 (⇧⌘P (Windows, Linux Ctrl+Shift+P)) 中,输入 Fabric: 创建项目.
-
选择您的工作区并选择用户数据功能。提供一个名称并选择Python语言。
-
您被通知设置Python虚拟环境并继续在本地设置。
-
使用以下命令安装库
使用pip安装或者选择 Fabric 扩展中的用户数据功能项以添加库。更新要求.txt文件用于指定依赖关系:fabric-user-data-functions ~= 1.0 pandas == 2.3.1 numpy == 2.3.2 requests == 2.32.5 scikit-learn=1.2.0 joblib=1.2.0 -
打开
functions_app.py. 以下是一个使用scikit-learn开发用户数据函数以进行数据科学的示例:import datetime import fabric.functions as fn import logging # Import additional libraries import pandas as pd from sklearn.ensemble import RandomForestClassifier from sklearn.preprocessing import StandardScaler from sklearn.model_selection import train_test_split from sklearn.metrics import accuracy_score import joblib udf = fn.UserDataFunctions() @udf.function() def train_churn_model(data: list, targetColumn: str) -> dict: ''' Description: Train a Random Forest model to predict customer churn using pandas and scikit-learn. Args: - data (list): List of dictionaries containing customer features and churn target Example: [{"Age": 25, "Income": 50000, "Churn": 0}, {"Age": 45, "Income": 75000, "Churn": 1}] - targetColumn (str): Name of the target column for churn prediction Example: "Churn" Returns: dict: Model training results including accuracy and feature information ''' # Convert data to DataFrame df = pd.DataFrame(data) # Prepare features and target numeric_features = df.select_dtypes(include=['number']).columns.tolist() numeric_features.remove(targetColumn) X = df[numeric_features] y = df[targetColumn] # Split and scale data X_train, X_test, y_train, y_test = train_test_split(X, y, test_size=0.2, random_state=42) scaler = StandardScaler() X_train_scaled = scaler.fit_transform(X_train) X_test_scaled = scaler.transform(X_test) # Train model model = RandomForestClassifier(n_estimators=100, random_state=42) model.fit(X_train_scaled, y_train) # Evaluate and save accuracy = accuracy_score(y_test, model.predict(X_test_scaled)) joblib.dump(model, 'churn_model.pkl') joblib.dump(scaler, 'scaler.pkl') return { 'accuracy': float(accuracy), 'features': numeric_features, 'message': f'Model trained with {len(X_train)} samples and {accuracy:.2%} accuracy' } @udf.function() def predict_churn(customer_data: list) -> list: ''' Description: Predict customer churn using trained Random Forest model. Args: - customer_data (list): List of dictionaries containing customer features for prediction Example: [{"Age": 30, "Income": 60000}, {"Age": 55, "Income": 80000}] Returns: list: Customer data with churn predictions and probability scores ''' # Load saved model and scaler model = joblib.load('churn_model.pkl') scaler = joblib.load('scaler.pkl') # Convert to DataFrame and scale features df = pd.DataFrame(customer_data) X_scaled = scaler.transform(df) # Make predictions predictions = model.predict(X_scaled) probabilities = model.predict_proba(X_scaled)[:, 1] # 将预测结果添加到原始数据中 results = customer_data.copy() for i, (pred, prob) in enumerate(zip(predictions, probabilities)): results[i]['churn_prediction'] = int(pred) results[i]['churn_probability'] = float(prob) 返回 结果 -
在本地测试您的函数,按F5。
-
在 Fabric 扩展中,在本地文件夹中,选择函数并发布到你的工作区。
了解更多关于调用该函数的信息:
使用Fabric笔记本进行数据科学
Fabric 笔记本是 Microsoft Fabric 中用于编写和运行代码、可视化和 markdown 的交互式工作簿。Notebooks 支持多种语言(Python、Spark、SQL、Scala 等),非常适合在 Fabric 中与 OneLake 中的现有数据一起进行数据探索、转换和模型开发。
示例
下面的单元格使用Spark读取CSV文件,将其转换为pandas,并使用scikit-learn训练一个逻辑回归模型。请用你的数据集值替换列名和路径。
def train_logistic_from_spark(spark, csv_path):
    # Read CSV with Spark, convert to pandas
    sdf = spark.read.option("header", "true").option("inferSchema", "true").csv(csv_path)
    df = sdf.toPandas().dropna()

    # Adjust these to match your dataset
    X = df[['feature1', 'feature2']]
    y = df['label']

    from sklearn.model_selection import train_test_split
    from sklearn.linear_model import LogisticRegression
    from sklearn.metrics import accuracy_score

    X_train, X_test, y_train, y_test = train_test_split(X, y, test_size=0.2, random_state=42)
    model = LogisticRegression(max_iter=200)
    model.fit(X_train, y_train)

    preds = model.predict(X_test)
    return {'accuracy': float(accuracy_score(y_test, preds))}

# 在Fabric笔记本单元格中的示例用法
# train_logistic_from_spark(spark, '/path/to/data.csv')
参考Microsoft Fabric Notebook 文档了解更多信息。
Git 集成
Microsoft Fabric 支持 Git 集成,使版本控制和数据与分析项目的协作成为可能。您可以将 Fabric 工作区连接到 Azure DevOps 或 GitHub 等 Git 仓库,仅同步受支持的项目。此集成还支持 CI/CD 工作流,使团队能够高效地管理发布并维护高质量的分析环境。
下一步
既然您已经在 VS Code 中设置好了 Microsoft Fabric 扩展,请探索这些资源以深化您的知识:
与社区互动并获得支持: